Business intelligence and HR analytics — interactive dashboards for KPIs, country-level staff analytics, gender distribution, and multi-department reporting.
This project involved designing and building a suite of interactive Power BI dashboards for organisational analytics, with a strong focus on Human Resources and operations. The dashboards give leadership and HR teams a single place to monitor headcount, satisfaction, training, and diversity across countries and departments.
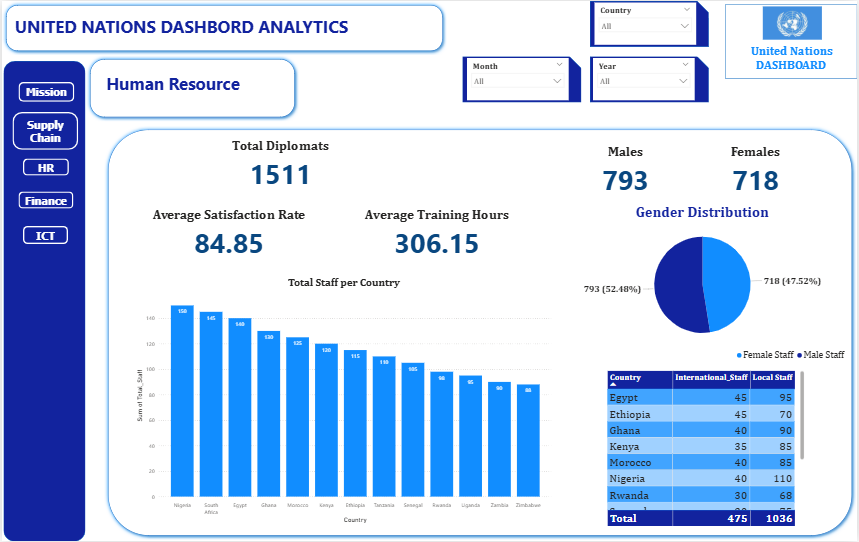
Users can filter by country, month, and year to answer questions quickly without touching raw data.
I designed the data model and report structure in Power BI, then built multiple linked views. The HR dashboard centres on headline KPIs at the top so that senior stakeholders see the main numbers immediately.
Below the KPIs I added a bar chart showing total staff per country for clear geographic distribution, and a donut chart for gender split (52.48% male, 47.52% female). A detailed breakdown table shows international versus local staff by country — Egypt, Ethiopia, Ghana, Kenya, and others — all linked to the same filter controls.
All visuals respond to the same slicer panel (country, month, year) so selecting any region or time period updates every chart and table consistently.
Dashboard Navigation Modules
Stakeholders can now explore HR and operational metrics in one place, with clear visuals and drill-down by country and time. The dashboards support planning, diversity reporting, and capacity discussions with data that is consistent, filterable, and easy to interpret.