Advanced Excel dashboards and data models for reporting and decision support — turning messy spreadsheets into clean, reusable business tools.
Many teams rely on Excel for reporting but struggle with slow, error-prone workbooks, unclear structure, and no single view of key metrics. Data is often copied manually between sheets, and there's no easy way to slice by period, region, or product without rebuilding the report.
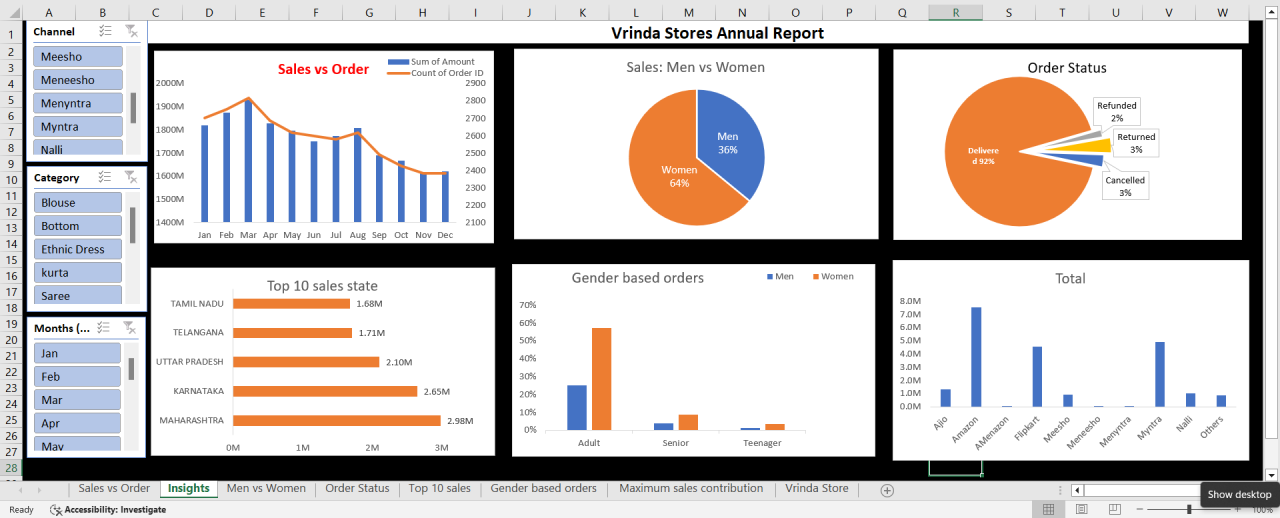
Leadership needed clear, repeatable dashboards that could be updated with new data without constant rework or relying on a data analyst every month.
I designed and built Excel-based solutions that turn raw data into structured reports and dashboards. The workbooks are built for reuse — when new data is added, the user refreshes or pastes into the data sheet, and all dashboards and PivotTables update automatically.
I used dynamic arrays, named ranges, and conditional formatting so that KPIs and exceptions are visible at a glance, and added Power Pivot data models where multiple tables needed to be combined for ratio and trend measures.
Teams have reliable, reusable Excel templates and dashboards that support monthly reporting and ad hoc analysis without heavy IT support. Decision-making is faster because the data is structured and the views are consistent.