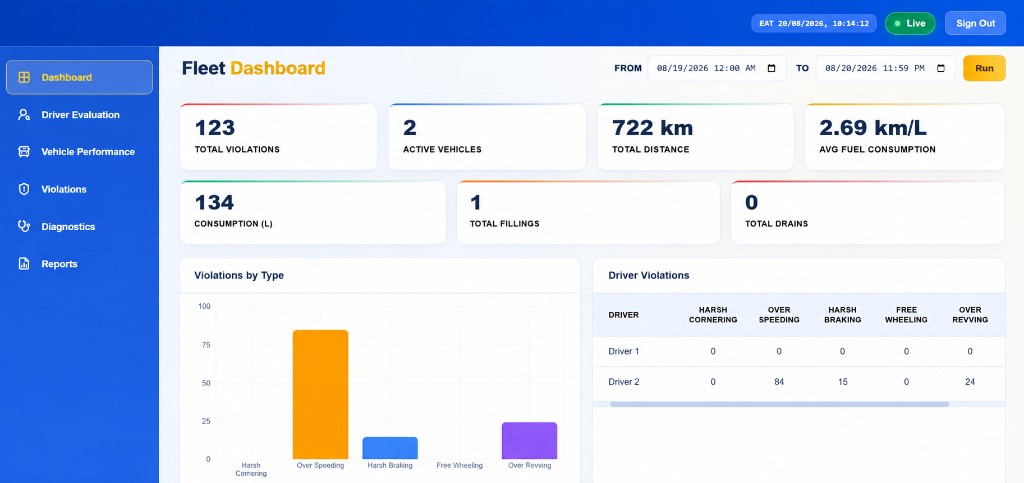
A live fleet operations dashboard for a logistics company — powered by Wialon API data and simplified to the metrics operations teams actually use every day.
The logistics company already had telematics devices feeding into Wialon, but the default views were too dense for day-to-day fleet decisions. Managers needed a clearer picture of violations, active vehicles, distance, fuel use, and which drivers needed attention.
They wanted a simplified dashboard application shaped around their workflow — not another generic telematics screen.
I pulled live fleet data through the Wialon API and built a dashboard application tailored to the company's needs — KPI cards, date-range filters, violation charts, and a driver-level performance table.
The app surfaces what matters for operations: total violations, active vehicles, distance travelled, average fuel consumption, fillings and drains, plus breakdowns by violation type such as over speeding, harsh braking, and over revving.
Modules for driver evaluation, vehicle performance, violations, diagnostics, and reports keep the experience focused on logistics decision-making rather than raw telematics noise.
Operations can now review fleet health in one place — live status, date filters, and clear driver and violation views that match how the logistics team actually works.